One Project Management Dashboard Replaces a Week of Status Reports
A leading electrical contractor was assembling project status by hand from an ERP and a set of spreadsheets. Proxsoft Global built a five-page live view covering cost, change orders, labor, vendor invoices and billing.
Client snapshot
Industry
Electrical contracting
Systems in play
ERP for cost and job data, spreadsheets for status
Who it serves
Project managers, operations leadership, finance
What we built
A five-page project management dashboard in Power BI
Dashboard pages
Project overview, cost summary, time cards, vendor invoices, billing
Engagement type
Data model, dashboard build, reconciliation and handover

The Challenge
Project managers had no single view of project health. Status sat in one place, cost in the ERP, and schedule in spreadsheets each PM maintained their own way. Nothing was wrong with any individual source. Answering a simple question meant opening three of them. The effect showed up every reporting cycle. PMs spent hours compiling updates ahead of review meetings, which is time producing information rather than acting on it. And because compilation happened on a cycle, leadership learned about a cost overrun or a slipping milestone after it had already happened. That second point was the one that mattered. A variance identified in a monthly pack is a post-mortem. The same variance seen in week two is still a decision.
Status, cost and schedule in three places, none reconciled to each other.
Each PM keeping their own spreadsheet format, so portfolio comparison was impossible.
Hours per PM per cycle spent assembling rather than managing.
Change orders tracked separately from the cost they affect.
Leadership visibility arriving after budgets or timelines had already moved.
What Proxsoft built
A five-page project management dashboard in Power BI, built on the same approach we use for Power BI dashboards for construction: agree the definitions, model the data properly, build the visuals last. Filters run down the left of every page so a user narrows by company, project manager, status code, job, cost type and date once, and the whole dashboard follows. The design decision that shaped everything else was drill-through. Each figure traces to the transaction underneath it, because the first question after any variance is which cost caused it. The result is a project management dashboard that carries the whole job rather than a summary of it. A PM can answer a cost question, a labor question and a billing question without leaving the report or opening the ERP.
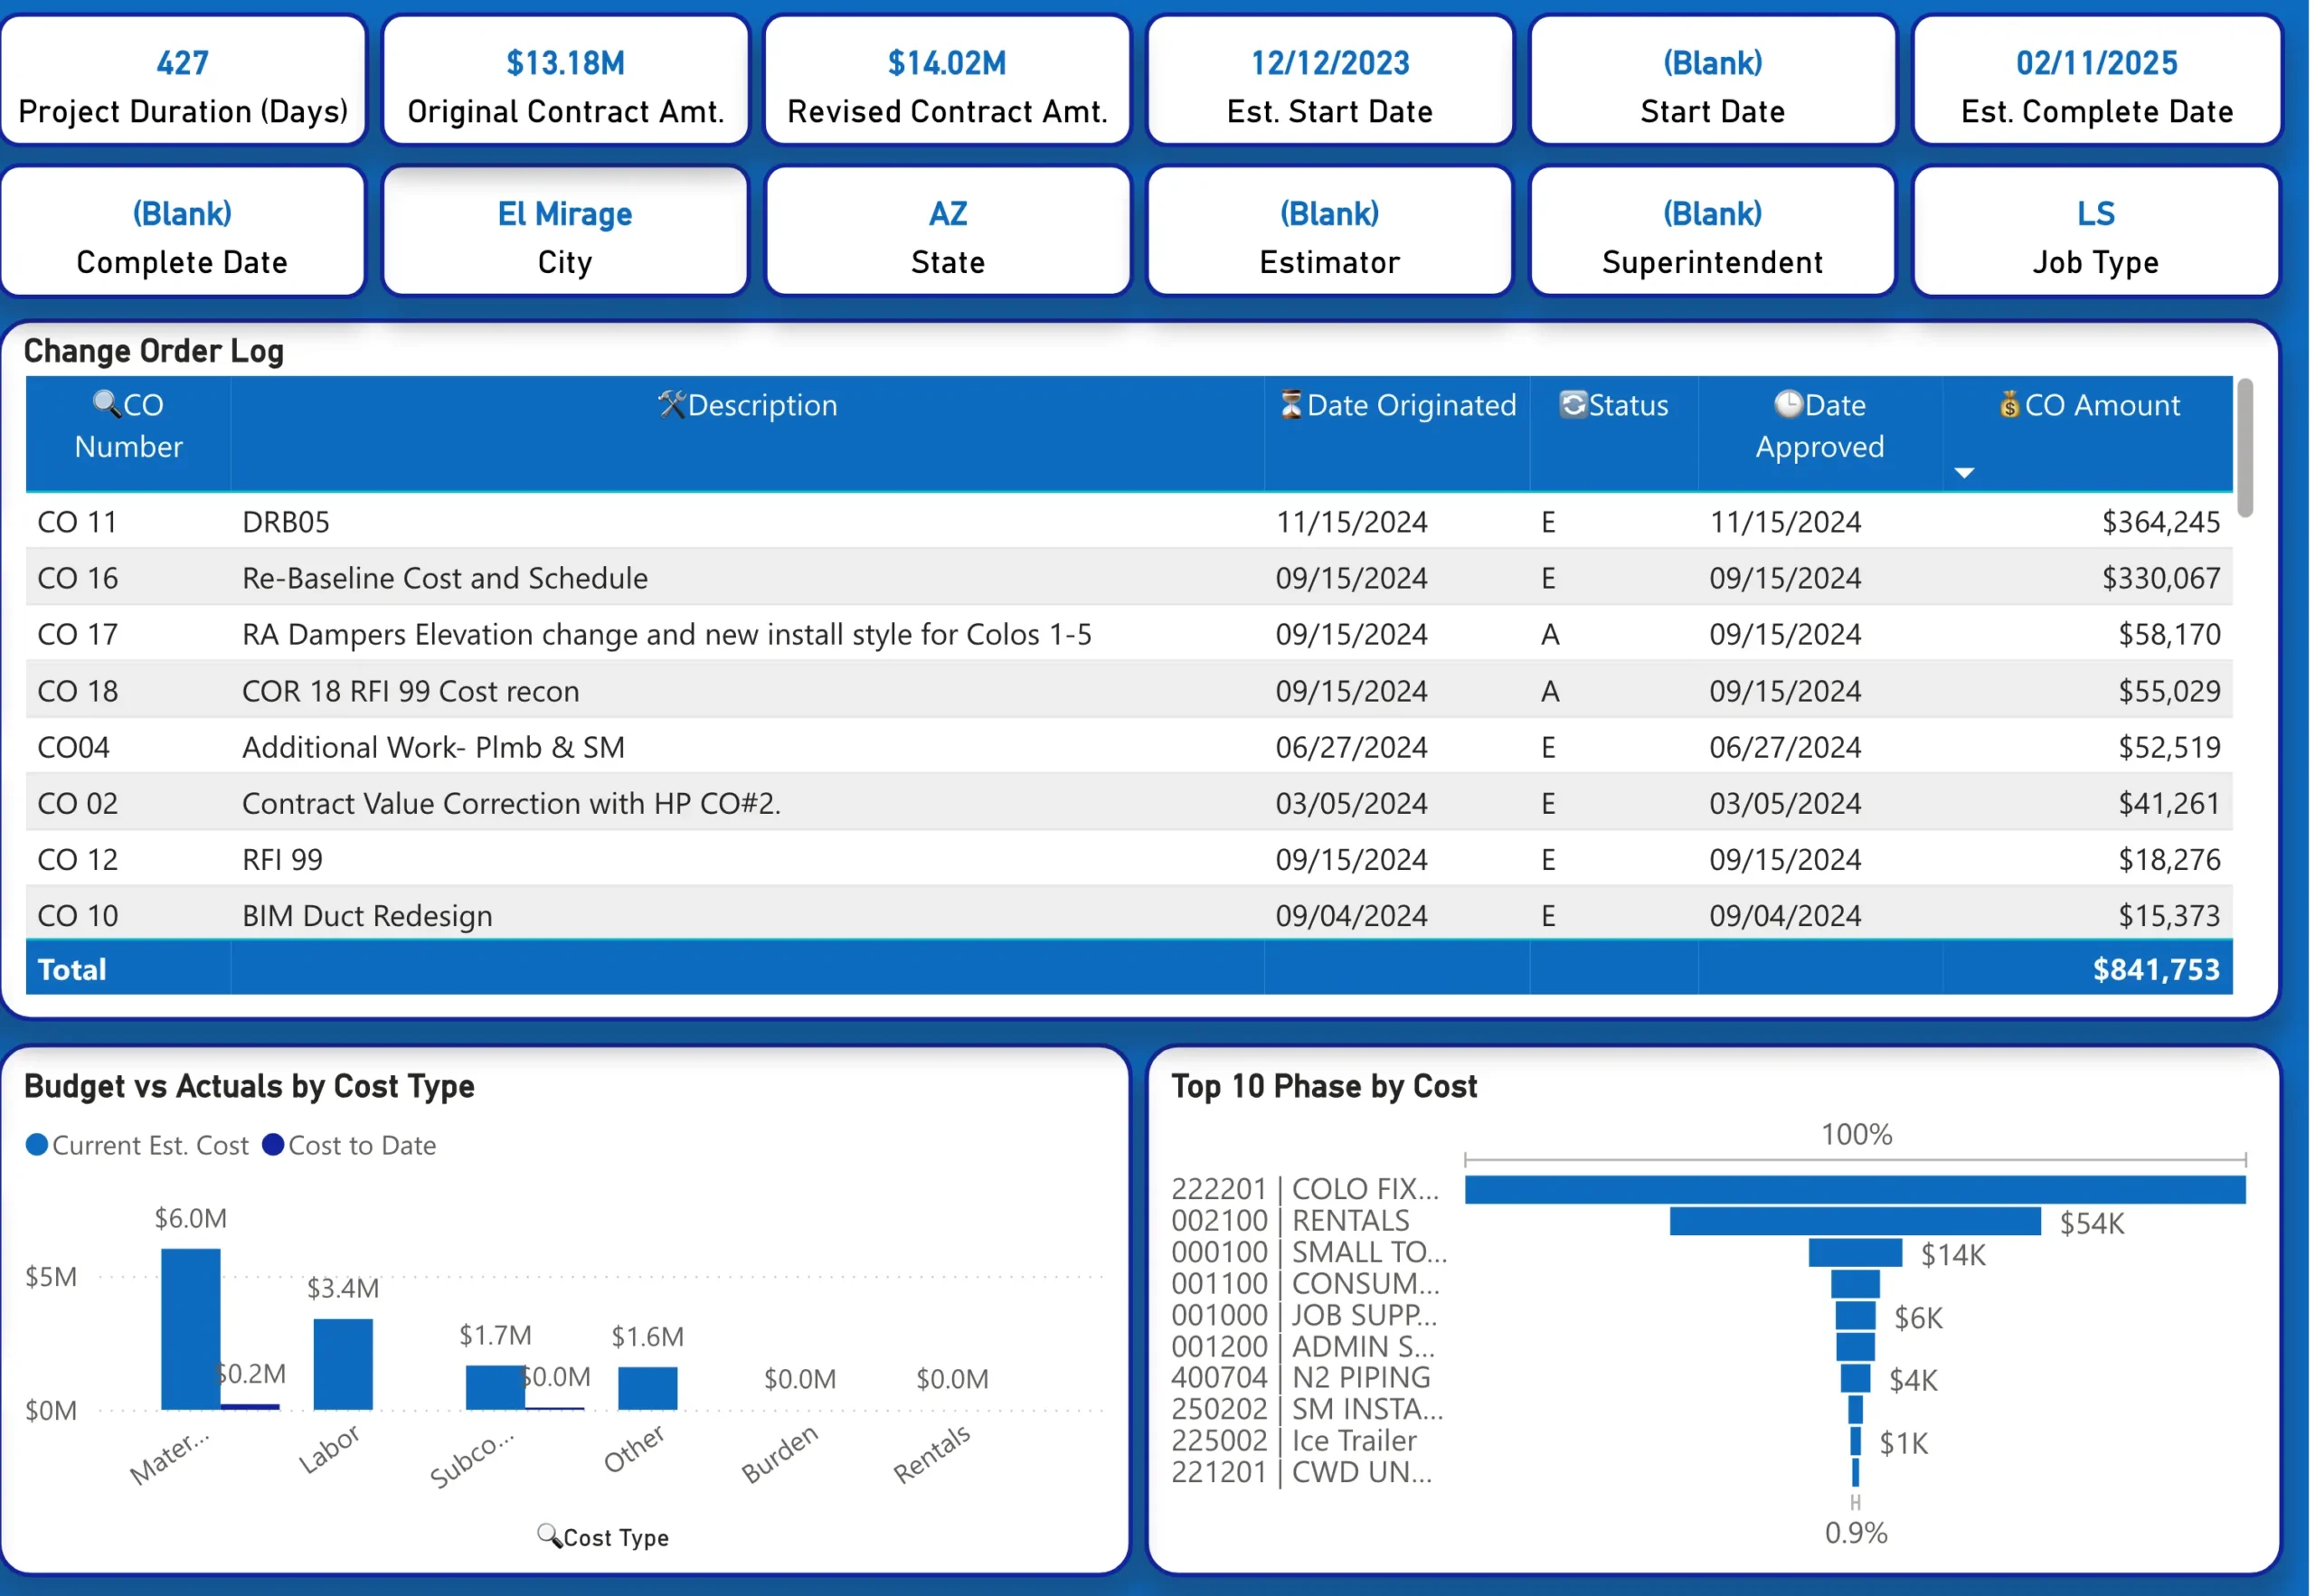
The project overview page. Contract values and dates across the top, the full change order log with approval status and running total in the middle, and budget against actual by cost type below. Filter rail cropped.
What is actually on the dashboard
Page
What it shows
Project overview
Contract duration, original and revised contract amount, estimated and actual start and completion dates, city, state, job type, estimator and superintendent, plus a full change order log with status, approval date and running total
Project cost summary
Job to date cost, current estimated cost and projected cost by cost type, with projected minus estimate and job to date minus estimate variances, hours against estimate, and cost percent complete. Drill-through to cost detail
Time cards
Hours by employee, phase and date across every pay type, with an hours by period trend underneath
Vendor invoices
Invoice and transaction dates, invoice and purchase order numbers, phase, description and amount by vendor, with invoice value by quarter
Billing
Invoice amount, total open balance, retention amount, pending amount and days past due, with anything beyond ninety days flagged
Two views do most of the work in practice. The change order log puts every CO, its approval status and its value against the contract in one place, which is where electrical contractors most often lose margin visibility. And the billing page separates retention from open balance and ages both, so the cash conversation is about specific invoices rather than a single total. Budget versus actual by cost type sits on the opening page, splitting current estimated cost against cost to date across material, labor, subcontract, other, burden and rentals. Alongside it, a top ten phases by cost view shows where the money is concentrated.
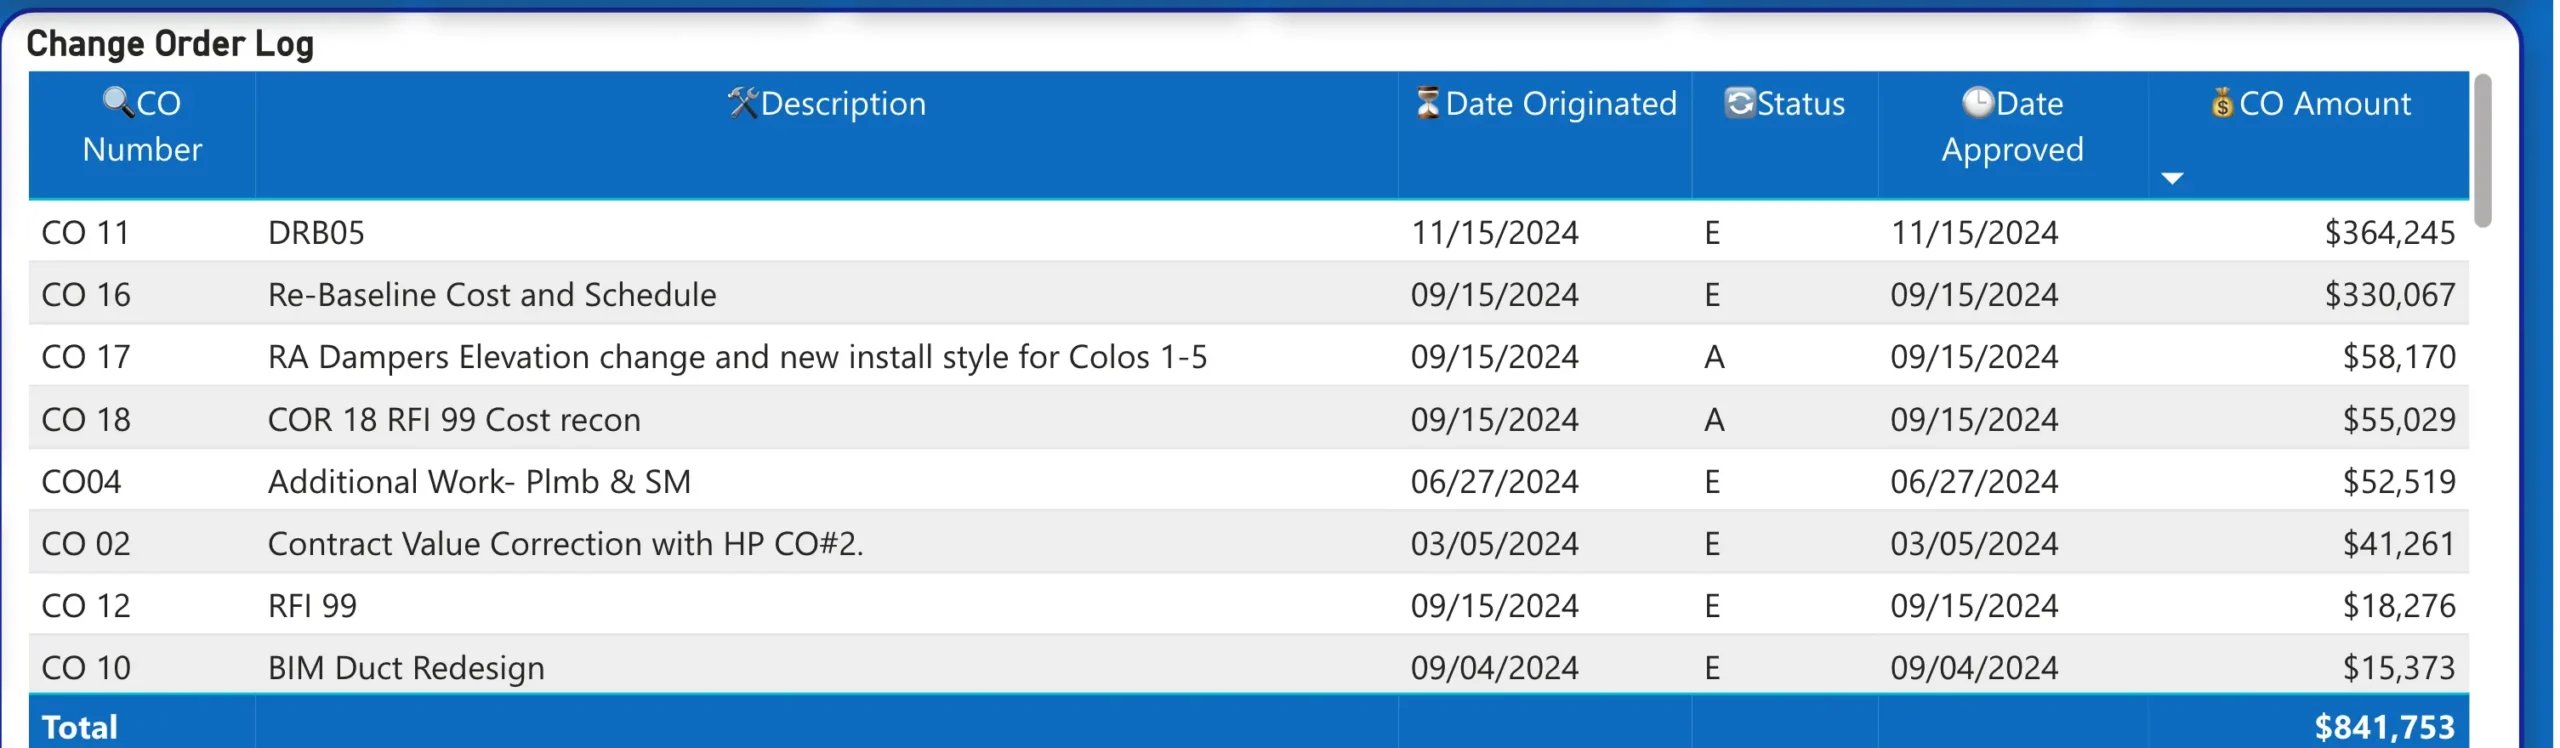
The change order log. Every CO with its description, origination and approval dates, status and value, totalled against the contract. This is where electrical contractors most often lose margin visibility.
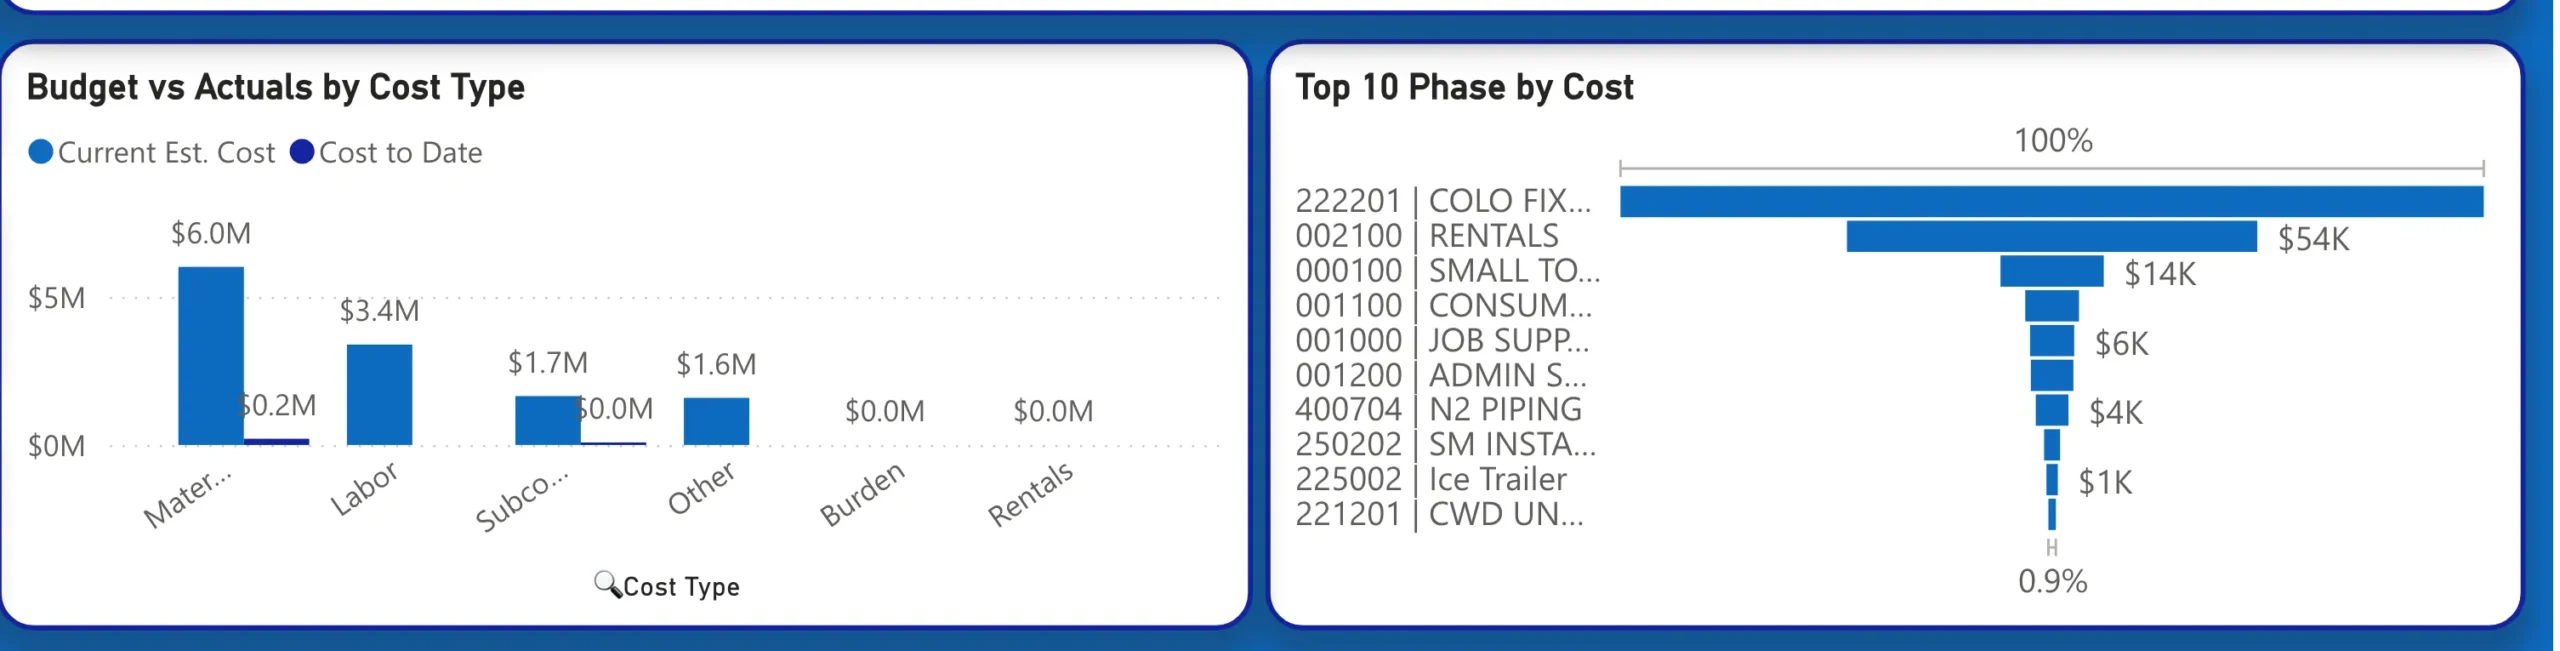
Budget against actual by cost type, split across material, labor, subcontract, other, burden and rentals, beside the ten phases carrying the most cost.
Live dashboard embed
How we approached it

Agreed the definitions first. What counts as committed cost, how percent complete is calculated, and who may change a forecast. Settled in writing before any visual was built.

Reconciled to a closed period, with every difference explained rather than rounded away.

Built drill-through at every layer, down to the transaction.

Released to a small group of PMs, watched how they used it, and fixed their complaints before widening access.

Handed over with a named internal owner, because reporting decays without one.
The reconciliation step is the one most often skipped and the one that decides whether a project management dashboard is trusted. A single disagreement with the close costs more credibility than months of accurate reporting earn back.
The outcome
Project managers now work from a live source rather than a report they built themselves. The compilation that used to precede every review cycle is no longer part of the job. Leadership sees at-risk projects early. Cost overruns and slipping milestones surface while there is still room to respond, rather than appearing in a pack after the fact. Because every PM now reads the same definitions, portfolio conversations stopped opening with an argument about whose numbers were right.
A single project management dashboard replacing per-PM spreadsheets.
Change orders, cost, labor, vendor invoices and billing on one connected model.
Retention and open balance aged separately, so cash discussions are specific.
Drill-through from any figure to the transaction behind it.
If your project managers are assembling status reports by hand, the first step is usually smaller than people expect. Proxsoft Global builds reporting for construction and specialty trade contractors. Book a call and we will map your current reporting against what your data already supports.